Global burden of bacterial antimicrobial resistance in 2019: a systematic analysis

Global burden of bacterial antimicrobial resistance in 2019: a systematic analysis

Copyright © 2022 The Author(s). Published by Elsevier Ltd. This is an Open Access article under the CC BY 4.0 license.Licence.

Global burden of bacterial antimicrobial resistance in 2019: a systematic analysis

Copyright © 2022 The Author(s). Published by Elsevier Ltd. This is an Open Access article under the CC BY 4.0 license.Licence.

Introduction

Bacterial antimicrobial resistance (AMR)—which occurs when changes in bacteria cause the drugs used to treat infections to become less effective—has emerged as one of the leading public health threats of the 21st century. The Review on Antimicrobial Resistance, commissioned by the UK Government, argued that AMR could kill 10 million people per year by 2050.1, 2 Although these forecasts have been criticised by some,3, 4 WHO and numerous other groups and researchers agree that the spread of AMR is an urgent issue requiring a global, coordinated action plan to address.5, 6, 7, 8 Information about the current magnitude of the burden of bacterial AMR, trends in different parts of the world, and the leading pathogen–drug combinations contributing to bacterial AMR burden is crucial. If left unchecked, the spread of AMR could make many bacterial pathogens much more lethal in the future than they are today.

One major challenge to tackling AMR is understanding the true burden of resistance, particularly in locations where surveillance is minimal and data are sparse. Extensive literature exists estimating the effects of AMR on incidence, deaths, hospital length of stay, and health-care costs for select pathogen–drug combinations in specific locations,1, 2, 6, 9, 10, 11, 12 but, to our knowledge, no comprehensive estimates covering all locations and a broad range of pathogens and pathogen–drug combinations have ever been published. For instance, the US Centers for Disease Control and Prevention (CDC) published a 2019 report on AMR infections and deaths in the USA for 18 AMR threats using surveillance data,6 while Cassini and colleagues10 estimated the burden of eight bacterial pathogens and 16 pathogen–drug combinations in the EU and European Economic Area for 2007–15. Likewise, Lim and colleagues estimated the burden of multidrug resistance in six bacterial pathogens in Thailand in 2010,11 and Temkin and colleagues estimated the incidence of Escherichia coli and Klebsiella pneumoniae resistant to third-generation cephalosporins and carbapenems in 193 countries in 2014.12

Although these publications are important contributions to the body of work on AMR, they are insufficient to understand the global burden of AMR and identify and target the highest priority pathogens in different locations. Additionally, existing studies have generally considered only one measure of AMR burden.13 Because we do not know the extent to which drug-resistant infections would be replaced by susceptible infections or by no infection in a scenario in which all drug resistance was eliminated, it is important to quantify the burden on the basis of both these counterfactual scenarios.

In this study, we present the first global estimates of the burden of bacterial AMR covering an extensive set of pathogens and pathogen–drug combinations using consistent methods for both counterfactual scenarios.

Methods

Overview

We developed an approach for estimating the burden of AMR that makes use of all available data and builds on death and incidence estimates for different underlying conditions from the Global Burden of Diseases, Injuries, and Risk Factors Study (GBD) 2019, which provides age-specific and sex-specific estimates of disease burden for 369 diseases and injuries in 204 countries and territories in 1990–2019.14 Our approach can be divided into ten estimation steps that occur within five broad modelling components (a flowchart of the estimation steps is given in the appendix p 123). First, we obtained data from multiple data sources, including from published studies (eg, microbiology data, inpatient data, data on multiple causes of death, and pharmaceutical sales data) and directly from collaborators on the Global Research on Antimicrobial Resistance project,15 members of the GBD Collaborator Network, and other data providers.

We estimated the disease burdens associated with and attributable to AMR for 12 major infectious syndromes (lower respiratory infections and all related infections in the thorax; bloodstream infections; peritoneal and intra-abdominal infections; meningitis and other bacterial CNS infections; typhoid, paratyphoid, and invasive non-typhoidal Salmonella spp; urinary tract infections and pyelonephritis; diarrhoea; tuberculosis [not including tuberculosis associated with HIV]; bacterial infections of the skin and subcutaneous systems; endocarditis and other cardiac infections; infections of bones, joints, and related organs; and gonorrhoea and chlamydia) and one residual category, 23 bacterial pathogens, 18 drug categories or combinations of drugs for which there is resistance, and 88 pathogen–drug combinations (appendix pp 45–46). We modelled all-age and age-specific deaths and disability-adjusted life-years (DALYs) for 204 countries and territories, and we present aggregated estimates for 21 GBD regions, seven GBD super-regions, and globally in 2019 (a full list of GBD locations by region is available in the appendix pp 100–05).16
For the first counterfactual scenario—where all drug-resistant infections are replaced by susceptible infections—we estimated only deaths and DALYs directly attributable to resistance. For the second counterfactual scenario—where all drug-resistant infections are replaced by no infection—we estimated all deaths and DALYs associated with resistant infection. Estimates of AMR burden based on each counterfactual are useful in different ways for informing the development of potential intervention strategies to control AMR.13, 17, 18

Input data

We used several data collection strategies. Through our large collaborator networks, we obtained datasets not previously available for AMR research, including hospital and laboratory data, as well as datasets published previously and those outlined in research articles.19 Each component of the estimation process had different data requirements and, as such, the input data used for each modelling component differed. The diverse data sought included the following sources: pharmaceutical companies that run surveillance networks, diagnostic laboratories, and clinical trial data; high-quality data from researchers including large multisite research collaborations, smaller studies, clinical trials, and well established research institutes based in low-income and middle-income countries (LMICs); data from public and private hospitals and public health institutes providing diagnostic testing; global surveillance networks; enhanced surveillance systems; national surveillance systems; and surveillance systems for specific organisms such as Mycobacterium tuberculosis and Neisseria gonorrhoeae (all sources are listed by data type in the appendix pp 8–15).

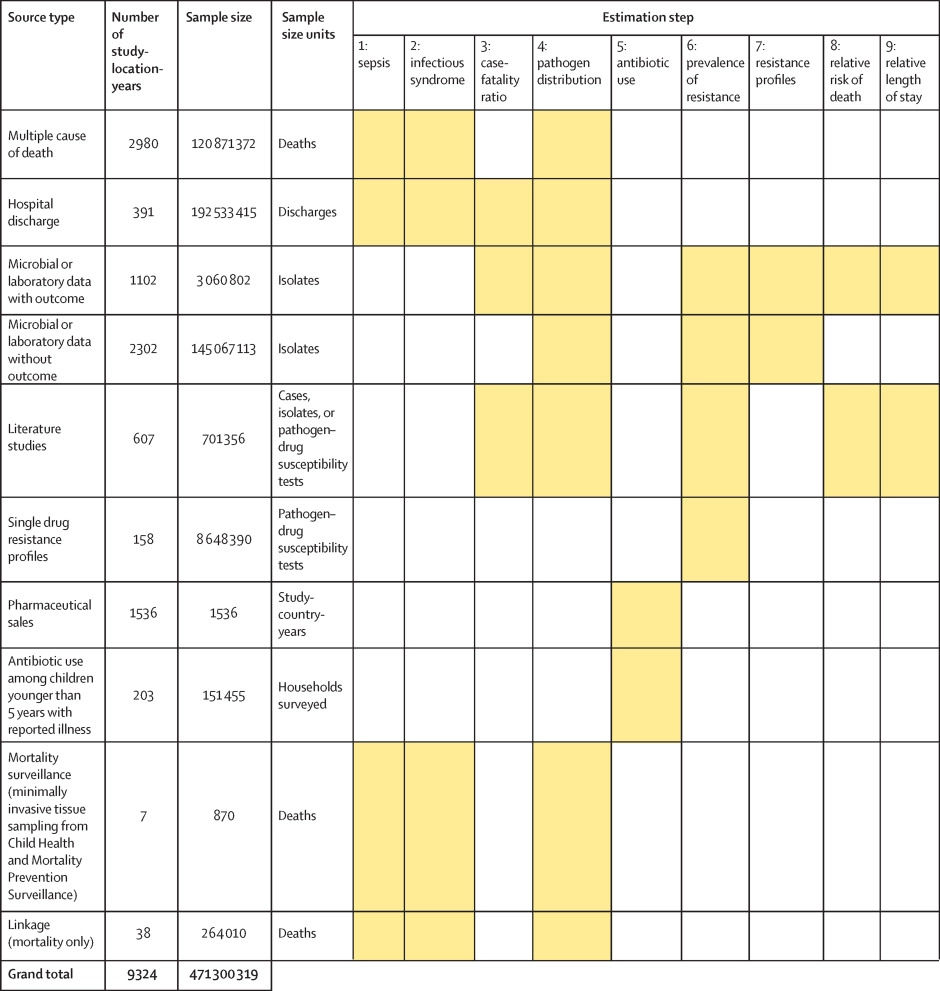
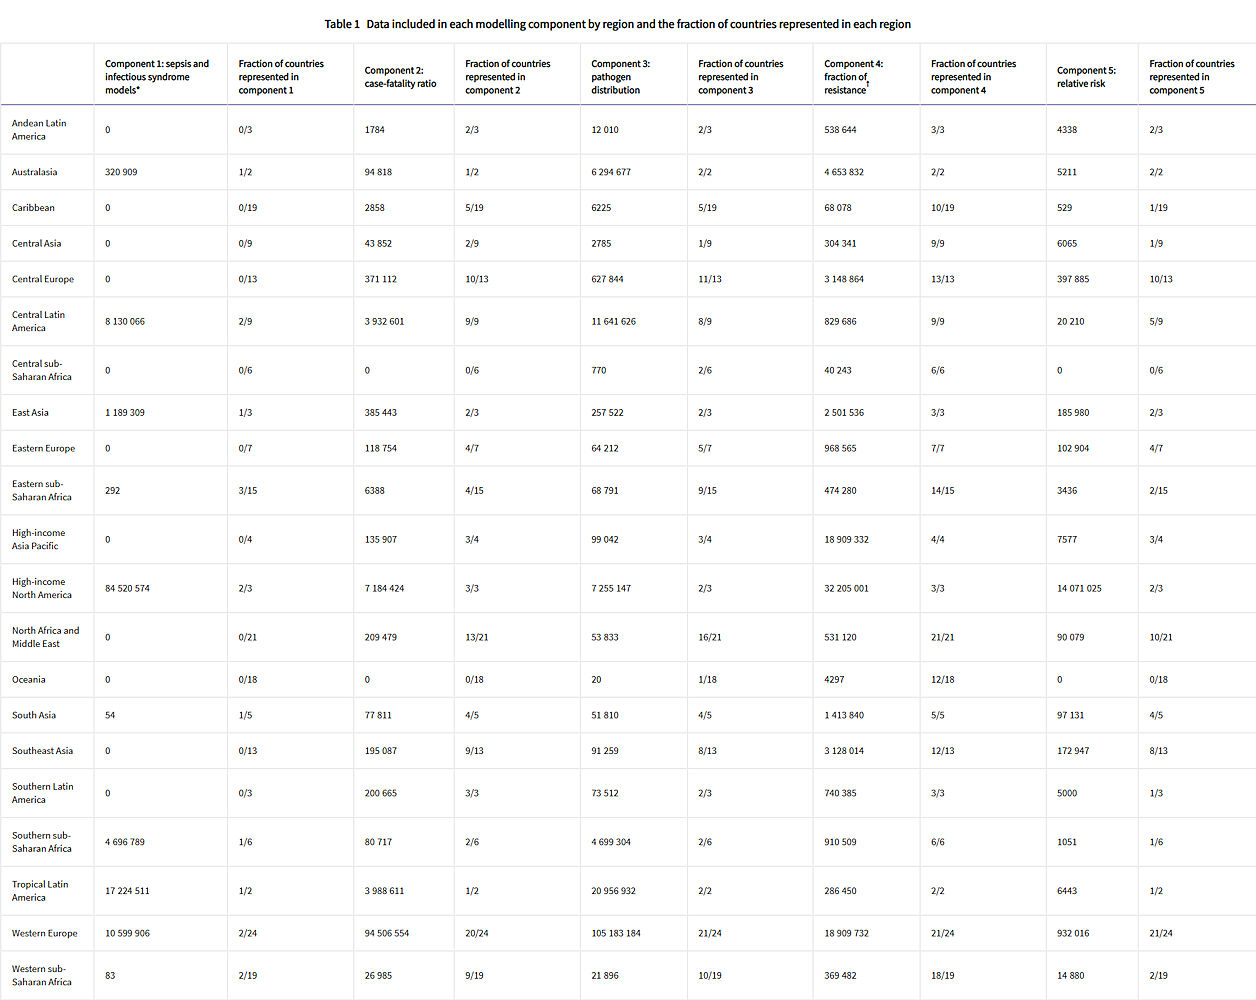
Figure 1 shows a summary of the distinct data types gathered and for which estimation step each data type was used. Also shown in figure 1 is the number of unique study-location-years and individual records or isolates available for each data type. Location-years of data refer to unique GBD locations and years for which we have records or isolates. In total, 471 million individual records or isolates covering 7585 study-location-years were used as input data to the estimation process. Table 1 shows the number of individual records or isolates used and number of countries covered in each of the five broad modelling components separately by GBD region. Two of five components included data from every GBD region and two of five included data from 19 of 21 GBD regions. Our models of sepsis and infectious syndrome were the most geographically sparse, covering 16 countries from ten regions; the input data for these models were highly detailed microdata that are only sparsely available. However, our framework for estimating the total envelope of infectious syndrome mortality used GBD cause-specific mortality estimates to minimise reliance on these sparse data.

Figure 1Data inputs by source type - Global burden of bacterial antimicrobial resistance in 2019: a systematic analysis

Click image for larger view.

Figure 1: Data inputs by source type

Total sample size for each source type, regardless of specific inclusion criteria for a given estimation step. Individual isolates that were tested multiple times for resistance to different antibiotics are listed only once here whenever isolates were identified uniquely in the data. For datasets where isolates could not be uniquely identified across pathogen–drug combinations, such as some antimicrobial resistance surveillance systems, some isolates might be double counted. Yellow boxes indicate that the source type was used in that estimation step. A full list of data sources included in this study, organised by data type, is included in the appendix (pp 8–15).

Table 1: Data included in each modelling component by region and the fraction of countries represented in each region - Global burden of bacterial antimicrobial resistance in 2019: a systematic analysis

Click image for larger view.

Table 1: Data included in each modelling component by region and the fraction of countries represented in each region

Total sample size and fraction of countries covered for each modelling component by GBD region. The units for sample size are deaths for sepsis and infectious syndrome models; cases for case-fatality ratios; cases, deaths, or isolates for pathogen distribution; pathogen–drug tests for fraction of resistance; and pathogen–drug tests for relative risk. Sample sizes reflect model-specific selection criteria, resulting in lower totals for the sepsis, infectious syndrome, case-fatality ratio, and pathogen distribution models in this table than those in figure 1. Totals for fraction of resistance and relative risk are higher in this table than in figure 1 because of the difference in units for certain source types, such as microbial data (isolates in figure 1, pathogen–drug tests here). Several data sources inform multiple components; therefore, data points should not be summed across a row as that will lead to duplication. More information on the data types used and the components that they inform is presented in the appendix (pp 8–15). GBD=Global Burden of Diseases, Injuries, and Risk Factors Study.

* The data points listed in the sepsis and infectious syndrome models include only sources used to determine the fraction of sepsis in non-communicable diseases; maternal, neonatal, and nutritional diseases; and injuries, as well as the distribution of infectious syndromes; final estimates of the number of deaths in each infectious syndrome were generated by multiplying the fractions of sepsis and infection syndromes on GBD 2019 death estimates; GBD 2019 death estimates include 7417 sources with 28 106 location-years of data for under-5 mortality and 7355 sources with over 7322 location-years of data.
† For sources in the fraction of resistance modelling component, de-duplication across antibiotic resistance tests was not possible, leading to potential double counting, as seen in the high-income Asia Pacific region.

All data inputs for the models were empirical data, not modelled estimates, except for a custom meta-analysis of vaccine probe data that we did to estimate the fraction of pneumonia caused by Streptococcus pneumoniae (appendix pp 37–38). All study-level covariates for models, such as age and sex, were extracted from empirical data. All country-level covariates were modelled estimates that were produced previously for GBD 2019,20, 21 or those that were modelled by Browne and colleagues.22

First, to define the number of deaths where infection plays a role, we used GBD 2019 cause of death estimates14 to determine the number of deaths by age, sex, and location for which either the underlying cause of death was infectious or—for non-communicable, maternal, neonatal, nutritional, and injury deaths—for which the pathway to death was through sepsis. Sepsis is defined as a life-threatening organ dysfunction due to a dysregulated host response to infection.23 The methods used to estimate infectious underlying causes of death and sepsis deaths have been published previously14, 24 and are summarised in the appendix (pp 17–18).
In estimation step one, we used data for multiple causes of death covering 121 million deaths, 5·54 million hospital discharges with discharge status of death, and 264 000 records of multiple causes of death linked to hospital records from ten countries and territories, as well as 870 deaths from Child Health and Mortality Prevention Surveillance (CHAMPS) sites across six countries (appendix pp 17–18), to develop random effects logistic regression models to predict the fraction of sepsis occurring in each communicable, maternal, neonatal, and nutritional underlying cause of death; non-communicable underlying cause of death; and injury underlying cause of death. This approach follows the methods validated by many researchers in sepsis epidemiology25, 26, 27, 28 and used by Rudd and colleagues.24

We then multiplied the fraction of sepsis predicted from the logistic regression models onto GBD cause-specific mortality estimates to determine the mortality envelope for our analysis. Our mortality envelope consisted of all deaths in which infection played a role, which included all sepsis deaths with non-infectious underlying causes, plus all deaths with an infectious underlying cause in GBD 2019 (appendix pp 21–23).

In estimation step two, we used details on the pathways of disease provided in multiple causes of death and hospital discharge data in a second stage of random effects logistic regression models to further subdivide deaths in which infection played a role into 12 major infectious syndromes and one residual category. These regressions predicted the proportion of sepsis-related deaths that were caused by a given infectious syndrome separately for each communicable, maternal, neonatal, and nutritional underlying cause of death; non-communicable underlying cause of death; and injury underlying cause of death. We used this fraction to subdivide sepsis deaths with non-infectious underlying causes into specific infectious syndromes. For underlying causes of death that are themselves infectious, all deaths were assigned to their single corresponding infectious syndrome (eg, the GBD cause “lower respiratory infections” was assigned to the infectious syndrome “lower respiratory infections and all related infections in the thorax”; appendix pp 21–23).

Due to the pathogen distributions varying substantially for hospital-acquired and community-acquired infections in two infectious syndromes—lower respiratory and thorax infections and urinary tract infections—we further estimated the subdivision of these syndromes into community-acquired and hospital-acquired infections (appendix pp 17–30; table with community-acquired and hospital-acquired subdivisions presented on pp 24–25).

For the nine infectious syndromes in this study that were estimated as one or more causes of death and disability in GBD 2019 (lower respiratory and thorax infections; CNS infections; typhoid, paratyphoid, and invasive non-typhoidal Salmonella spp; urinary tract infections; diarrhoea; tuberculosis; bacterial skin infections; cardiac infections; and gonorrhoea and chlamydia), we used GBD 2019 incidence estimates as a baseline for infectious syndrome incidence (appendix p 16).14 To this baseline, we added the number of incident cases of each infectious syndrome that co-occurred with underlying non-communicable diseases (NCDs); maternal, neonatal, and nutritional diseases (MNNDs); and injuries, which we calculated by dividing the number of infectious syndrome deaths that occurred with underlying NCDs, MNNDs, and injuries (by age, sex, location, and GBD cause) by syndrome-specific and pathogen-specific case-fatality ratios (CFRs; estimation described in the following subsection). Bloodstream infections, bone and joint infections, and intra-abdominal infections are not estimated in GBD, so for these infectious syndromes, we exclusively used the number of incident cases of each infectious syndrome that co-occurred with underlying NCDs, MNNDs, and injuries to estimate incidence (appendix pp 56–60).
To estimate the pathogen distribution of each infectious syndrome separately for deaths and incident cases for each age, sex, and location, we made use of multiple data sources. For estimation step three, we took data that linked pathogen-specific disease incidence to deaths to develop models for pathogen-specific CFRs that varied by age, location, and syndrome. We used the Bayesian meta-regression tool MR-BRT29 to estimate CFRs as a function of the Healthcare Access and Quality Index and various bias covariates (appendix pp 31–34).21 These CFRs allowed us to integrate sources that reported pathogen distribution only for deaths and those that reported only incidence by mapping the reported deaths by pathogen into implied cases by pathogen. After mapping, we had 157 million isolates and cases from 118 countries and territories to estimate the pathogen distribution of each infectious syndrome (estimation step four), with each dataset including a unique spectrum of pathogens and groups of pathogens. To incorporate all these heterogeneous data, we used a new modelling environment, termed multinomial estimation with partial and composite observations. This modelling environment allows for the inclusion of covariates in the network analysis29 and for Bayesian prior probability distributions to be incorporated. To model the infectious syndrome pathogen distribution comprehensively, we estimated, where applicable, the incidence and death proportions attributable to viral, fungal, parasitic, and bacterial pathogens; however, AMR burden was calculated only for selected bacteria for which resistance is clinically relevant and sufficient data are available. More details on this approach are provided in the appendix (pp 34–44).
We used data from 52·8 million isolates to analyse the proportion of phenotypic AMR for each pathogen—the proportion of infections that were drug resistant, hereafter referred to as prevalence of resistance—for 88 pathogen–drug combinations. We chose these 88 combinations by first creating an exhaustive list of all clinically relevant combinations for which we had any data and then eliminating combinations that did not meet minimum data availability and computational feasibility requirements for accurate statistical modelling (appendix pp 59–60).
For the pathogen–drug combinations in the 2014 WHO AMR global report on surveillance,30 as well as fluoroquinolone and multidrug resistance in Salmonella enterica serotypes Typhi and Paratyphi, we supplemented microbial datasets from collaborators and surveillance networks with aggregate microbiology data from systematic reviews and published surveillance reports. The number of positive isolates identified for each pathogen–drug combination is shown in the appendix (pp 90–91). Clinical and Laboratory Standard Institute (CLSI) guidelines were used to define minimum inhibitory concentration breakpoints when these minimums were provided. When only a phenotypic disk interpretation was available, we used the interpretation as provided. We used two categories of susceptibility: susceptible and non-susceptible. The non-susceptible group includes isolates reported as “non-susceptible”, “intermediate”, and “resistant”. To account for bias in resistance data provided by tertiary care facilities, we adjusted tertiary rates of resistance by crosswalking them to data from non-tertiary and mixed facilities using MR-BRT as described in the appendix (pp 45–48).31

We used a two-stage spatiotemporal modelling framework to estimate the prevalence of resistance in each pathogen–drug combination by location for 2018. Given the many challenges to data collection and reporting caused by the COVID-19 pandemic,32, 33 as well as our collaborators’ process of data collation and cleaning, we were unable to collect more contemporary data; we assumed no change in prevalence of resistance for 2019. First, we fitted a stacked ensemble model between the input data and selected covariates from the list of plausible and health-related covariates available in GBD 2019 (appendix pp 48–49, 92–93); the estimates from the stacked ensemble model were then inputted into a spatiotemporal Gaussian process regression model31 to smooth the estimates in space and time. The exceptions to this modelling approach were multidrug-resistant (MDR) excluding extensively drug-resistant (XDR) tuberculosis and XDR tuberculosis, for which published GBD 2019 estimates were already available.14
Given the strong relationship between antibiotic consumption levels and the proliferation of resistance, we modelled antibiotic consumption at the national level to use as a covariate in the stacked ensemble model of prevalence of resistance. We analysed data from 65 Demographic and Health Surveys and 138 Multiple Indicator Cluster Surveys using model-based geostatistics to quantify antibiotic usage in LMICs. These LMIC-specific estimates of antibiotic usage were combined with pharmaceutical sales data from IQVIA, WHO, and the European Centre for Disease Prevention and Control (ECDC) by use of an ensemble spatiotemporal Gaussian process regression model to produce a location-year covariate on antibiotic consumption for all 204 countries and territories included in this study.22 Additional details on our estimation method for prevalence of resistance are available in the appendix (pp 44–53).

To account for multidrug resistance, we used line-level microbiology data that tested multiple antibiotics for the same isolate to produce Pearson correlation coefficients of the co-occurrence of resistance to different antibiotics. With these Pearson correlations and our prevalence of resistance estimates, we used an optimisation-based approach to solve for multivariate binomial distributions that define the prevalence of resistance of every combination of resistance to the antibiotics analysed. Every such distribution was characterised by a contingency table specifying probabilities of all combinations of resistance and susceptibility among the antibiotics analysed. The observed prevalence of each drug overall and Pearson correlations between drugs provided noisy partial observations of combinations of these entries. We optimised over the space of such contingency tables to find the nearest feasible distribution given the data, producing, for each pathogen, a set of resistance profiles: the proportions of bacteria with each combination of resistance and susceptibility among all the antibiotics analysed (appendix pp 48–49).

Using data from 164 sources representing 511 870 patients with known outcome and resistance information, we estimated the relative risk of death for each pathogen–drug combination for a resistant infection compared with that of a drug-sensitive infection using MR-BRT. Because of data sparsity, we assumed the relative risk was the same for every syndrome, location, and age group; the assumptions on location and age group risk are consistent with those in the estimation process previously used by Cassini and colleagues.10 We used a two-stage nested mixed effects meta-regression model to estimate relative risk of death for each pathogen–drug combination that was adjusted for age, admission diagnosis, hospital-acquired versus community-acquired infection, and site of infection (appendix pp 54–56). For the non-fatal excess risk, we estimated the relative increase in length of stay associated with a resistant infection compared with that of a drug-sensitive infection, adjusted for length of stay prior to culture being drawn. Data on length of stay were available from 59 sources representing 455 906 admissions. We used the same modelling framework for excess length of stay as we used for relative risk of death. Due to data sparsity on the excess risk of death associated with drug-resistant N gonorrhoeae, we did not produce a fatal estimate for this pathogen.

To produce burden estimates of multiple pathogen–drug combinations that were mutually exclusive within a given pathogen (and thus could be added), we produced a population-attributable fraction (PAF) for each resistance profile with resistance to at least one drug (appendix pp 56–60). The PAF represents the proportional reduction in deaths or years lived with disability (YLDs) that would occur if all infections with the resistance profile of interest were instead susceptible to all antibiotics included in the analysis. When two or more antibiotics were resistant in a single profile, we used the relative risk for the antibiotic class that was the largest as the relative risk for calculating the PAF:

PAF=Rkd(RRkD−1)1+∑nd=1Rkd(RRkD−1)

Where R is prevalence of resistance, RR is relative risk, K is a pathogen with d=1, …, n resistance profiles with resistance to at least one antibiotic class, and D is the antibiotic class in profile d with the highest relative risk (appendix pp 56–60).

We computed two counterfactuals to estimate the drug-resistant burden: the burden attributable to bacterial AMR based on the counterfactual of drug-sensitive infection and the burden associated with bacterial AMR based on the counterfactual of no infection (appendix pp 56–60). Briefly, to estimate the burden attributable to AMR, we first calculated the deaths attributable to resistance by taking the product of deaths for each underlying cause, the proportion of these deaths in which infection played a role, the proportion of infectious deaths attributable to each infectious syndrome, the proportion of infectious syndrome deaths attributable to each pathogen, and the mortality PAF for each resistance profile. We used previously described GBD methods14 to convert age-specific deaths into years of life lost (YLLs) using the standard counterfactual life expectancy at each age.34 To calculate attributable YLDs, we took the product of the infectious syndrome incidence, the proportion of infectious syndrome incident cases attributable to each pathogen, YLDs per incident case, and the non-fatal PAF. For resistance profiles that had resistance to more than one antibiotic class, we redistributed burden to the individual antibiotic classes proportionally on the basis of excess risk, providing a mutually exclusive burden for each pathogen–drug combination (appendix pp 56–60). To calculate DALYs, we took the sum of YLLs and YLDs. To estimate the overall AMR burden of the drug-sensitive counterfactual, we added the burden estimates of all the pathogen–drug combinations.

The approach for calculating the fatal burden associated with AMR was identical to that for fatal burden attributable to AMR, except we replaced the mortality PAF for each resistance profile with the prevalence of resistance in deaths. For the number of incident infections associated with resistance, we took the product of infectious syndrome incidence, the proportion of infectious incident cases attributable to each pathogen, and the prevalence of resistance in incident cases. On the basis of these death and incidence estimates, we then computed YLLs, YLDs, and DALYs associated with drug-resistant infections. We calculated YLLs using the same methods used to calculate YLLs attributable to AMR. We converted incidence into YLDs using a YLDs per incident case ratio for each infectious syndrome based on a proxy GBD cause (a simplified YLD calculation compared with the standard sequelae-based method; appendix pp 56–60). Finally, we calculated DALYs by summing YLLs and YLDs. To estimate the overall AMR burden of this counterfactual, we repeated the described calculations with the prevalence of resistance to one or more antibiotics estimated and summed across all pathogens.

Following previously described GBD methods,14 we propagated uncertainty from each step of the analysis into the final estimates of deaths and infections attributable to and associated with drug resistance by taking the 25th and 975th of 1000 draws from the posterior distribution of each quantity of interest. Out-of-sample validity estimates are provided in the appendix for our models of sepsis (pp 25–30), infectious syndrome distribution (pp 25–30), pathogen distribution (pp 43–44), prevalence of resistance (pp 51–53), and relative risk (pp 55–56).
The funders of the study had no role in study design, data collection, data analysis, data interpretation, or the writing of the report.

Results: Deaths Directly Attributable to Antibacterial Resistance

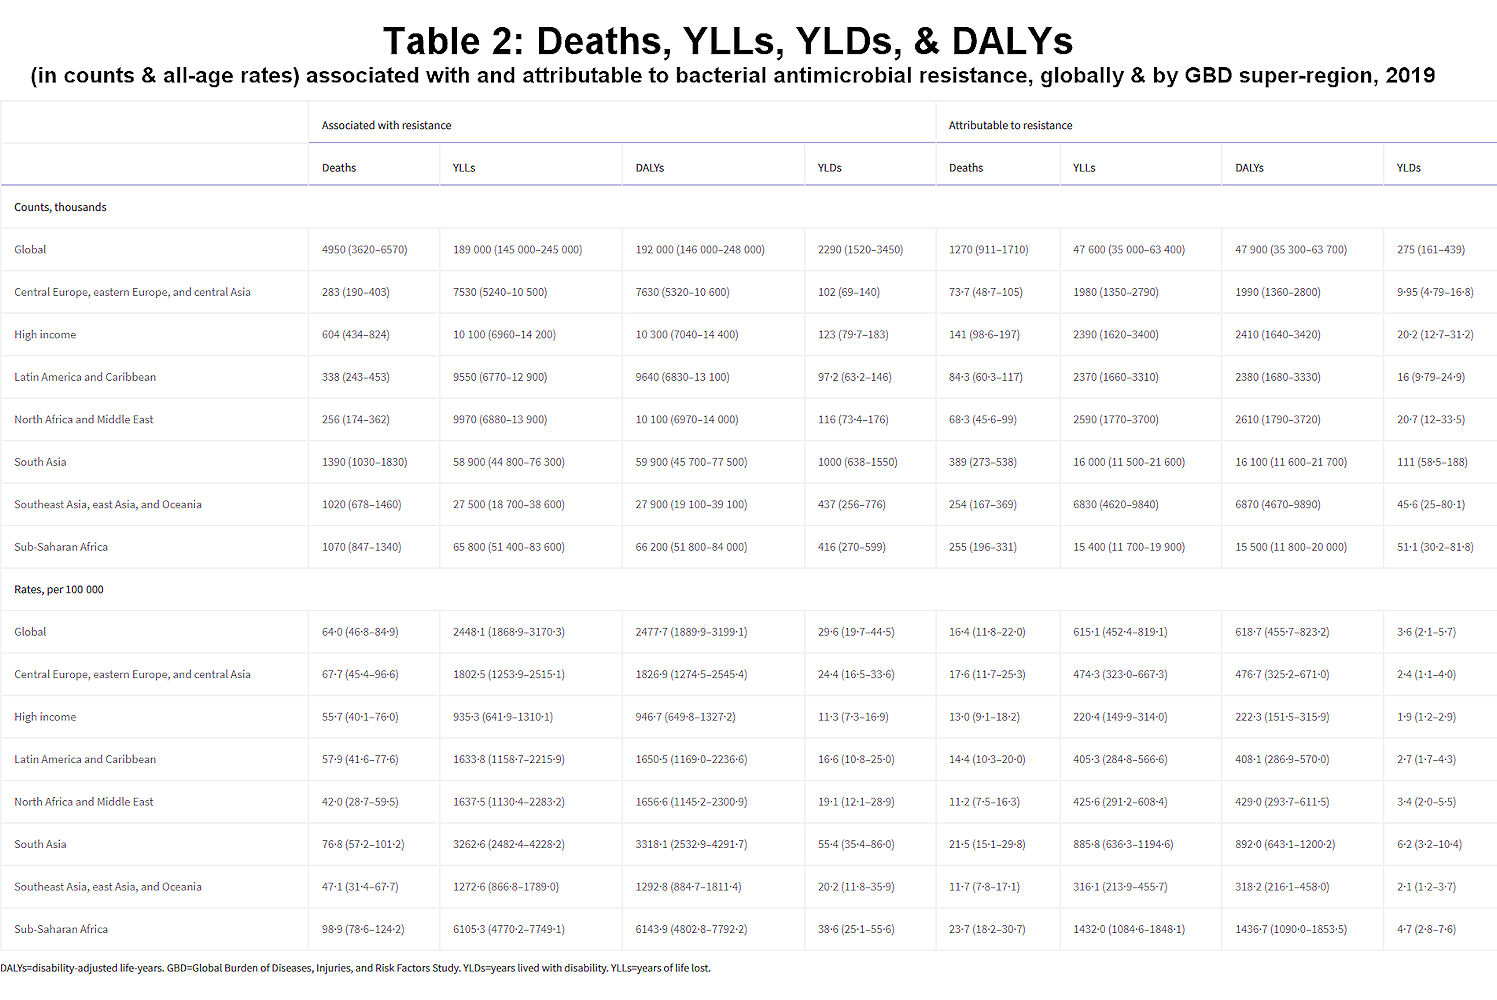
We estimated that, in 2019, 1·27 million deaths (95% uncertainty interval [UI] 0·911–1·71) were directly attributable to resistance (ie, based on the counterfactual scenario that drug-resistant infections were instead drug susceptible) in the 88 pathogen–drug combinations evaluated in this study. On the basis of a counterfactual scenario of no infection, we estimated that 4·95 million deaths (3·62–6·57) were associated with bacterial AMR globally in 2019 (including those directly attributable to AMR). Table 2 provides estimates of deaths, YLLs, and DALYs from AMR for each counterfactual.

Table 2Deaths, YLLs, YLDs, and DALYs (in counts and all-age rates) associated with and attributable to bacterial antimicrobial resistance, globally and by GBD super-region, 2019

Click image for larger view.

Table 2Deaths, YLLs, YLDs, and DALYs (in counts and all-age rates) associated with and attributable to bacterial antimicrobial resistance, globally and by GBD super-region, 2019

DALYs=disability-adjusted life-years. GBD=Global Burden of Diseases, Injuries, and Risk Factors Study. YLDs=years lived with disability. YLLs=years of life lost.

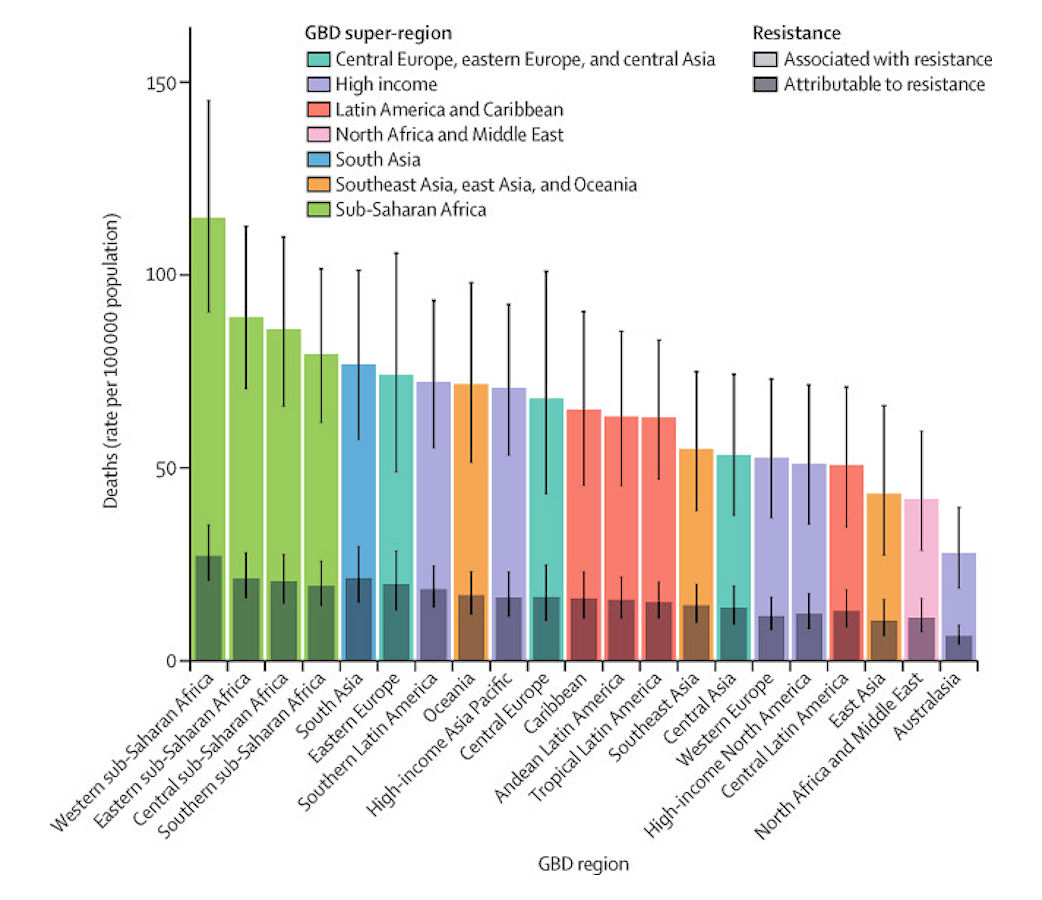
We estimated that among the 21 GBD regions, Australasia had the lowest AMR burden in 2019, with 6·5 deaths per 100 000 (95% UI 4·3–9·4) attributable to AMR and 28·0 deaths per 100 000 (18·8–39·9) associated with AMR in 2019 (figure 2). Western sub-Saharan Africa had the highest burden, with 27·3 deaths per 100 000 (20·9–35·3) attributable to AMR and 114·8 deaths per 100 000 (90·4–145·3) associated with AMR. Five regions had all-age death rates associated with bacterial AMR higher than 75 per 100 000: all four regions of sub-Saharan Africa and south Asia. Although sub-Saharan Africa had the highest all-age death rate attributable to and associated with AMR, the percentage of all infectious deaths attributable to AMR was lowest in this super-region (appendix p 97).

Figure 2: All-age rate of deaths attributable to and associated with bacterial antimicrobial resistance by GBD region, 2019

Click image for larger view.

Figure 2: All-age rate of deaths attributable to and associated with bacterial antimicrobial resistance by GBD region, 2019

Estimates were aggregated across drugs, accounting for the co-occurrence of resistance to multiple drugs. Error bars show 95% uncertainty intervals. GBD=Global Burden of Diseases, Injuries, and Risk Factors Study.

Natureza Patents New Antibiotic Agents

Natureza Patents New Antibiotic Agents

  • Chitosan-coated carboxylic acids show antimicrobial activity against antibiotic-resistant Gram-negative and positive pathogens.
  • Our novel antibiotic agents show activity against some of the deadliest multi-drug resistant pathogens and there’s NO RESISTANCE.
Natureza Develops a Transformative New Class of Antibiotics that Overcomes Bacterial Resistance

Natureza’s patented formulations introduce a transformative new class of antibiotic agents that overcome bacterial resistance and removes the time barrier of investment return.

Natureza’s research offers a true paradigm shift, one that would remove the imbalance in development cost by eliminating the ability of bacteria to become resistant. With the promise of new drugs being able to be marketed for years providing not only the time to recover investment, but a profit as well, a new investment environment would emerge that would encourage the development of new, much needed antibiotics.

[su_patentstatement]

Lack of New Antibiotics Threatens Global Efforts to Contain Drug-Resistant Fnfections - WHO 2020

Lack of New Antibiotics Threatens Global Efforts to Contain Drug-Resistant Infections

“Never has the threat of antimicrobial resistance been more immediate and the need for solutions more urgent,” says Dr Tedros Adhanom Ghebreyesus, Director-General of WHO.

Share this post

2022-10-03T22:13:51+00:00
Go to Top